Remote sensing One Liner
- Remote sensing involves collecting data about objects or areas without direct contact.
- Remote sensing is essential for monitoring crop growth.
- It helps estimate the cropped area for better resource management.
- Remote sensing is used for forecasting crop production.
- Mapping wastelands is facilitated through remote sensing technologies.
- It aids in drought monitoring and assessment.
- Flood mapping and damage assessment are crucial applications.
- Remote sensing helps in land use/cover mapping.
- It plays a role in assessing the area under forest coverage.
- Soil mapping can be done efficiently using remote sensing.
- Remote sensing helps assess soil moisture conditions.
- It assists in irrigation and drainage management.
- Pest and disease outbreaks can be monitored with remote sensing.
- Groundwater exploration is possible through remote sensing.
- Remote sensing platforms include ground-based, air-based, and satellite-based systems.
- Ground-based tools include infrared thermometers, spectral radiometers, and radars.
- Air-based remote sensing tools are usually mounted on aircraft.
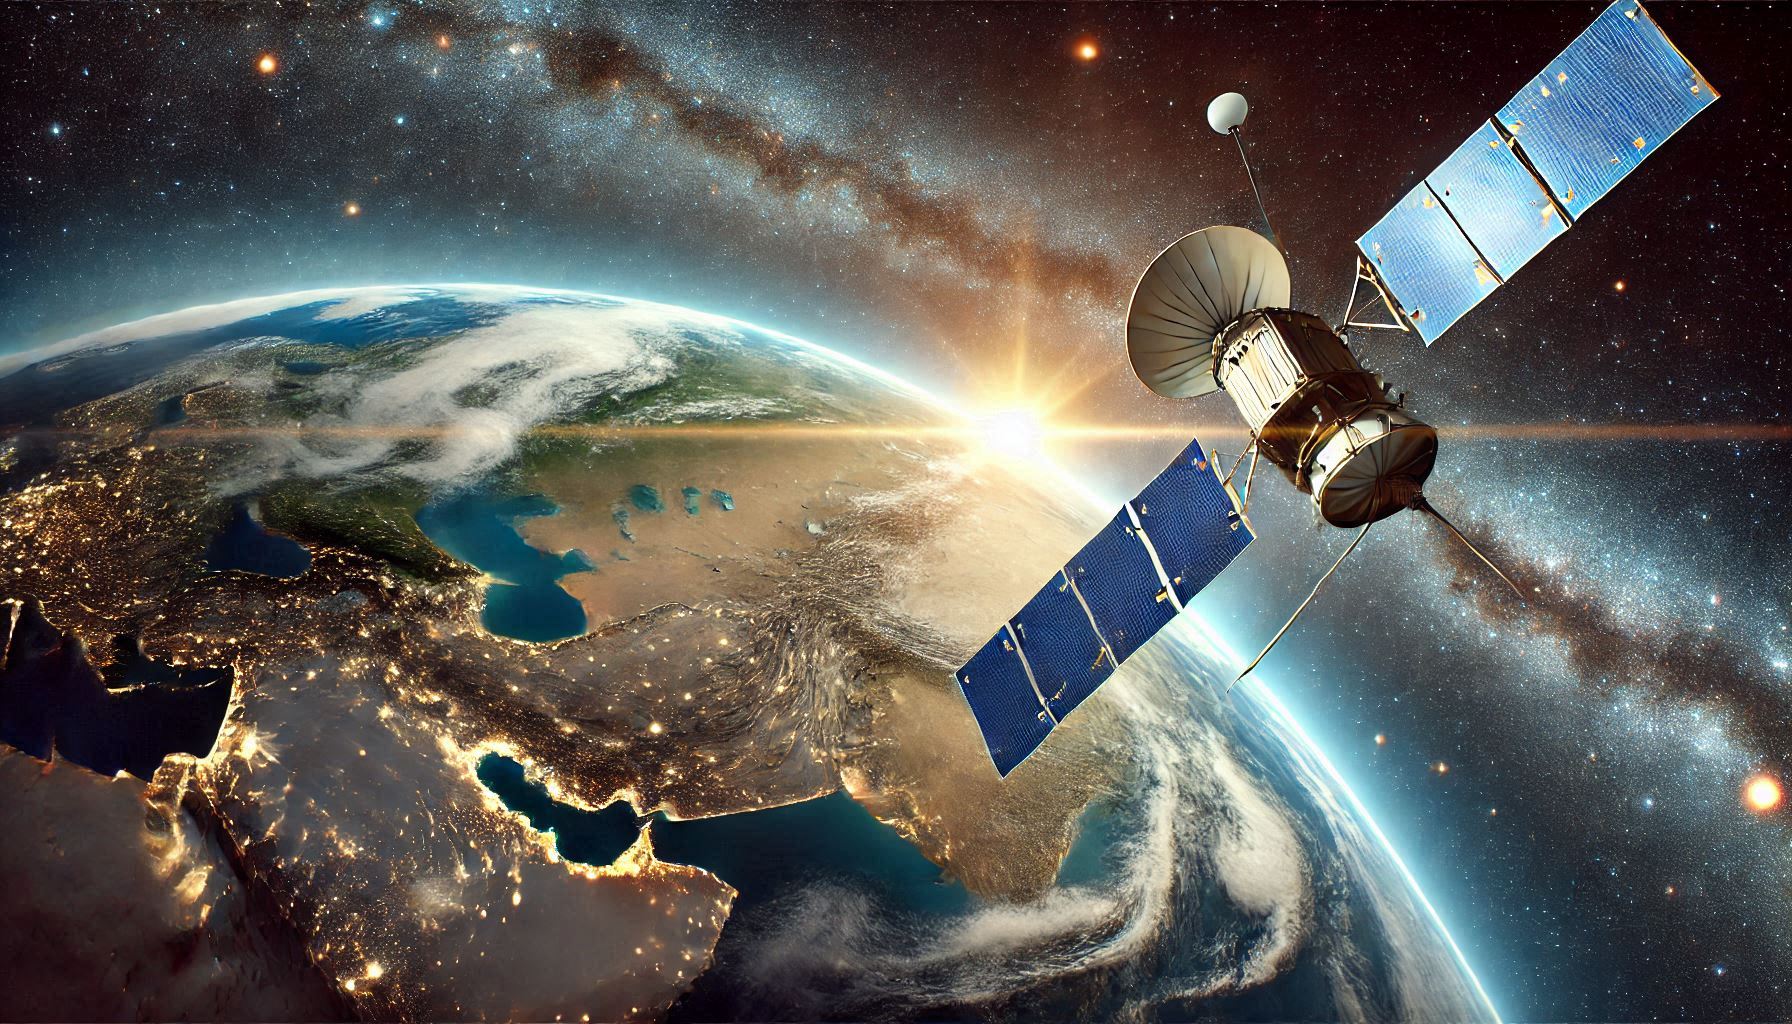
- Satellite-based remote sensing is the most common and widely used.
- Remote sensing satellites provide a synoptic view of large areas.
- One scene from an Indian Remote Sensing Satellite (IRS) covers about 148 x 178 km.
- IRS series satellites offer repeat coverage of the same area every 16-22 days.
- Remote sensing is valuable for mapping inaccessible areas like mountains and forests.
- Polar orbiting satellites are used for remote sensing at altitudes between 550-1,600 km.
- Polar orbiting satellites, such as LANDSAT (USA) and IRS (India), are key to remote sensing.
- Geostationary satellites orbit at 36,000 km above the equator.
- Geostationary satellites, like INSAT (India), are used for weather forecasting and telecommunication.
- INSAT-3A was launched by India on April 10, 2003, for communication and meteorological purposes.
- Satellite sensors operate in visible and near-infrared regions of the electromagnetic spectrum.
- Remote sensing in agriculture provides information on land use, soil, water resources, and climate.
- Agricultural productivity is the key concern in agriculture, with limited land expansion.
- Remote sensing helps in the optimal management of both land and water resources.
- Information on crops, their acreage, and vigor can be gathered through remote sensing.
- Remote sensing systems provide regular, synoptic, multi-temporal data for agricultural planning.
- The Indian Remote Sensing (IRS) program started in 1988 with the launch of IRS-IA.
- IRS series satellites, including IRS-IB, IRS-IC, and IRS-ID, followed the initial launch.
- ISRO (Indian Space Research Organisation) plays a key role in India’s remote sensing efforts.
- IRS satellites maintain continuity in data collection, launching every 3-4 years.
- Crop-weather modeling combines data from remote sensing and meteorological data.
- Crop models mathematically represent the interaction of crops with their environment.
- Crop growth depends on radiation interception, water/nutrient availability, and temperature.
- Crop growth and development are measured in phenophases from seeding to maturity.
- Crop models express the relationship between crop yield and weather parameters.
- Statistical models describe crop yield through statistical techniques and regression.
- Mechanistic models explain the relationships between weather parameters and yield.
- Deterministic models estimate the exact value of crop yield, using defined coefficients.
- Stochastic models incorporate probability elements for different outputs and yield predictions.
- Dynamic models incorporate time as a variable, accounting for changes over periods.
- Static models focus on constant values of dependent and independent variables.
- Simulation models use differential equations to estimate agricultural production over time.
- Descriptive models offer simple representations of system behavior without explaining mechanisms.
- Explanatory models explain crop growth processes through integrated descriptions of various factors.
- Climate change refers to permanent alterations in weather phenomena.
- Climate variability describes the temporal fluctuations in weather patterns.
- Global temperature has increased by 2.0 to 3.0°C in recent decades due to climate change.
- The concentration of CO2 in the atmosphere has increased from 180ppm to 350ppm.
- Climate change threatens livelihoods, with drought and desertification affecting 1-2 billion people.
- Weather-related disasters, such as floods, hurricanes, and forest fires, have become more common.
- The 1997-98 El Niño event affected 110 million people and cost the global economy $100 billion.
- From 1950-1999, climate-related disasters caused economic losses of $960 billion.
- External causes of climate change include changes in solar output and orbital variations.
- Solar output has increased by 0.3% compared to 1650-1700 AD data.
- Orbital variation influences Earth’s climate through eccentricity, precession, and axial tilt.
- Internal causes of climate change include changes in greenhouse gases and land surface changes.
- Afforestation and deforestation impact the climate by altering land surfaces and carbon cycles.
- El Niño refers to the abnormal warming of the ocean off the Peruvian coast, affecting global weather.
- La Niña represents the opposite of El Niño, with abnormally cold waters in the eastern Pacific.
- El Niño and La Niña events are associated with the Southern Oscillation, a sea-saw atmospheric pressure pattern.
- El Niño events lead to droughts in places like Peru and flooding in areas like Southeast Asia.
- La Niña events bring increased rainfall to Australia and continued drought in Peru.
- The Southern Oscillation Index (SOI) measures pressure differences between the Pacific and Indian Oceans.
- A positive SOI indicates high pressure in the Pacific and low pressure in Southeast Asia, promoting rainfall.
- A negative SOI suggests drought conditions due to high pressure over Indonesia and low pressure over the Pacific.
- Elevated CO2 and higher temperatures directly affect biological processes like photosynthesis and respiration.
- CO2 levels can benefit crop growth under certain conditions, but the effects vary by region.
- Remote sensing data is used for the timely assessment of crop diseases and pest outbreaks.
- Remote sensing supports land cover and land use changes, aiding environmental management.
- Remote sensing helps assess changes in the extent of water bodies and wetland areas.
- Remote sensing assists in urban planning and monitoring land degradation.
- The use of multispectral images is key to distinguishing different types of land cover and crop health.
- Remote sensing aids in detecting natural disasters like earthquakes, landslides, and tsunamis.
- Remote sensing technologies are key to monitoring climate and environmental changes.
- Near-infrared and thermal infrared data are critical for assessing crop health.
- Remote sensing also supports precision farming by helping in irrigation management.
- Remote sensing systems can measure soil temperature and moisture, crucial for farming decisions.
- Remote sensing can monitor forest cover, detect deforestation, and assess forest health.
- The use of radar in remote sensing helps in monitoring soil moisture and rainfall.
- Ground-based sensors can track environmental variables such as soil pH and temperature.
- Remote sensing is used to map and monitor agricultural pests and crop diseases over large areas.
- Satellite imagery is used in disaster response for mapping damage and assessing recovery needs.
- Remote sensing data can be processed and analyzed using Geographic Information Systems (GIS).
- Remote sensing provides real-time data, crucial for timely decision-making in agriculture.
- Remote sensing supports precision agriculture, enhancing crop yield through targeted interventions.
- Hyperspectral remote sensing offers detailed data on crop species, water bodies, and land features.
- Remote sensing data is crucial for land reclamation and desertification control efforts.
- Soil erosion monitoring and land conservation are supported through remote sensing technologies.
- Remote sensing contributes to early warning systems for floods and natural hazards.
- Climate change models integrate remote sensing data to predict future agricultural scenarios.
- Crop yield prediction using remote sensing helps in formulating policies for food security.
- Remote sensing satellites can monitor changes in glaciers, helping in climate research.
- Global environmental monitoring and management are increasingly dependent on remote sensing technologies.

